Get real-time troubleshooting with the new Diagnostics Tab

Key waiting room data points—like fast re-enters or cancelled queue IDs—can help alert you to technical problems with the implementation of the virtual waiting room. Queue-it’s Waiting Room Monitor now includes additional data on user behavior to help you more quickly identify and troubleshoot any issues with an active waiting room.
Use Case
The GO Platform Monitor is your go-to reporting overview for an active waiting room, where you can monitor queue inflow and outflow or expected wait time to understand how the waiting room is functioning.
There are cases where it would be useful to see additional data allowing you to optimize the user flow and experience. For instance, if you see many visitors who have been through the waiting room rejoin quickly, it could point to technical problems with an integration or an unresponsive target site.
Getting this additional user behavior data would help you stay one step ahead of any technical problems, letting you expedite troubleshooting and minimize customer complaints.
Solution
To help you get a fuller picture of waiting room data, Queue-it has beefed up the GO Platform Monitor with a Diagnostics tab.
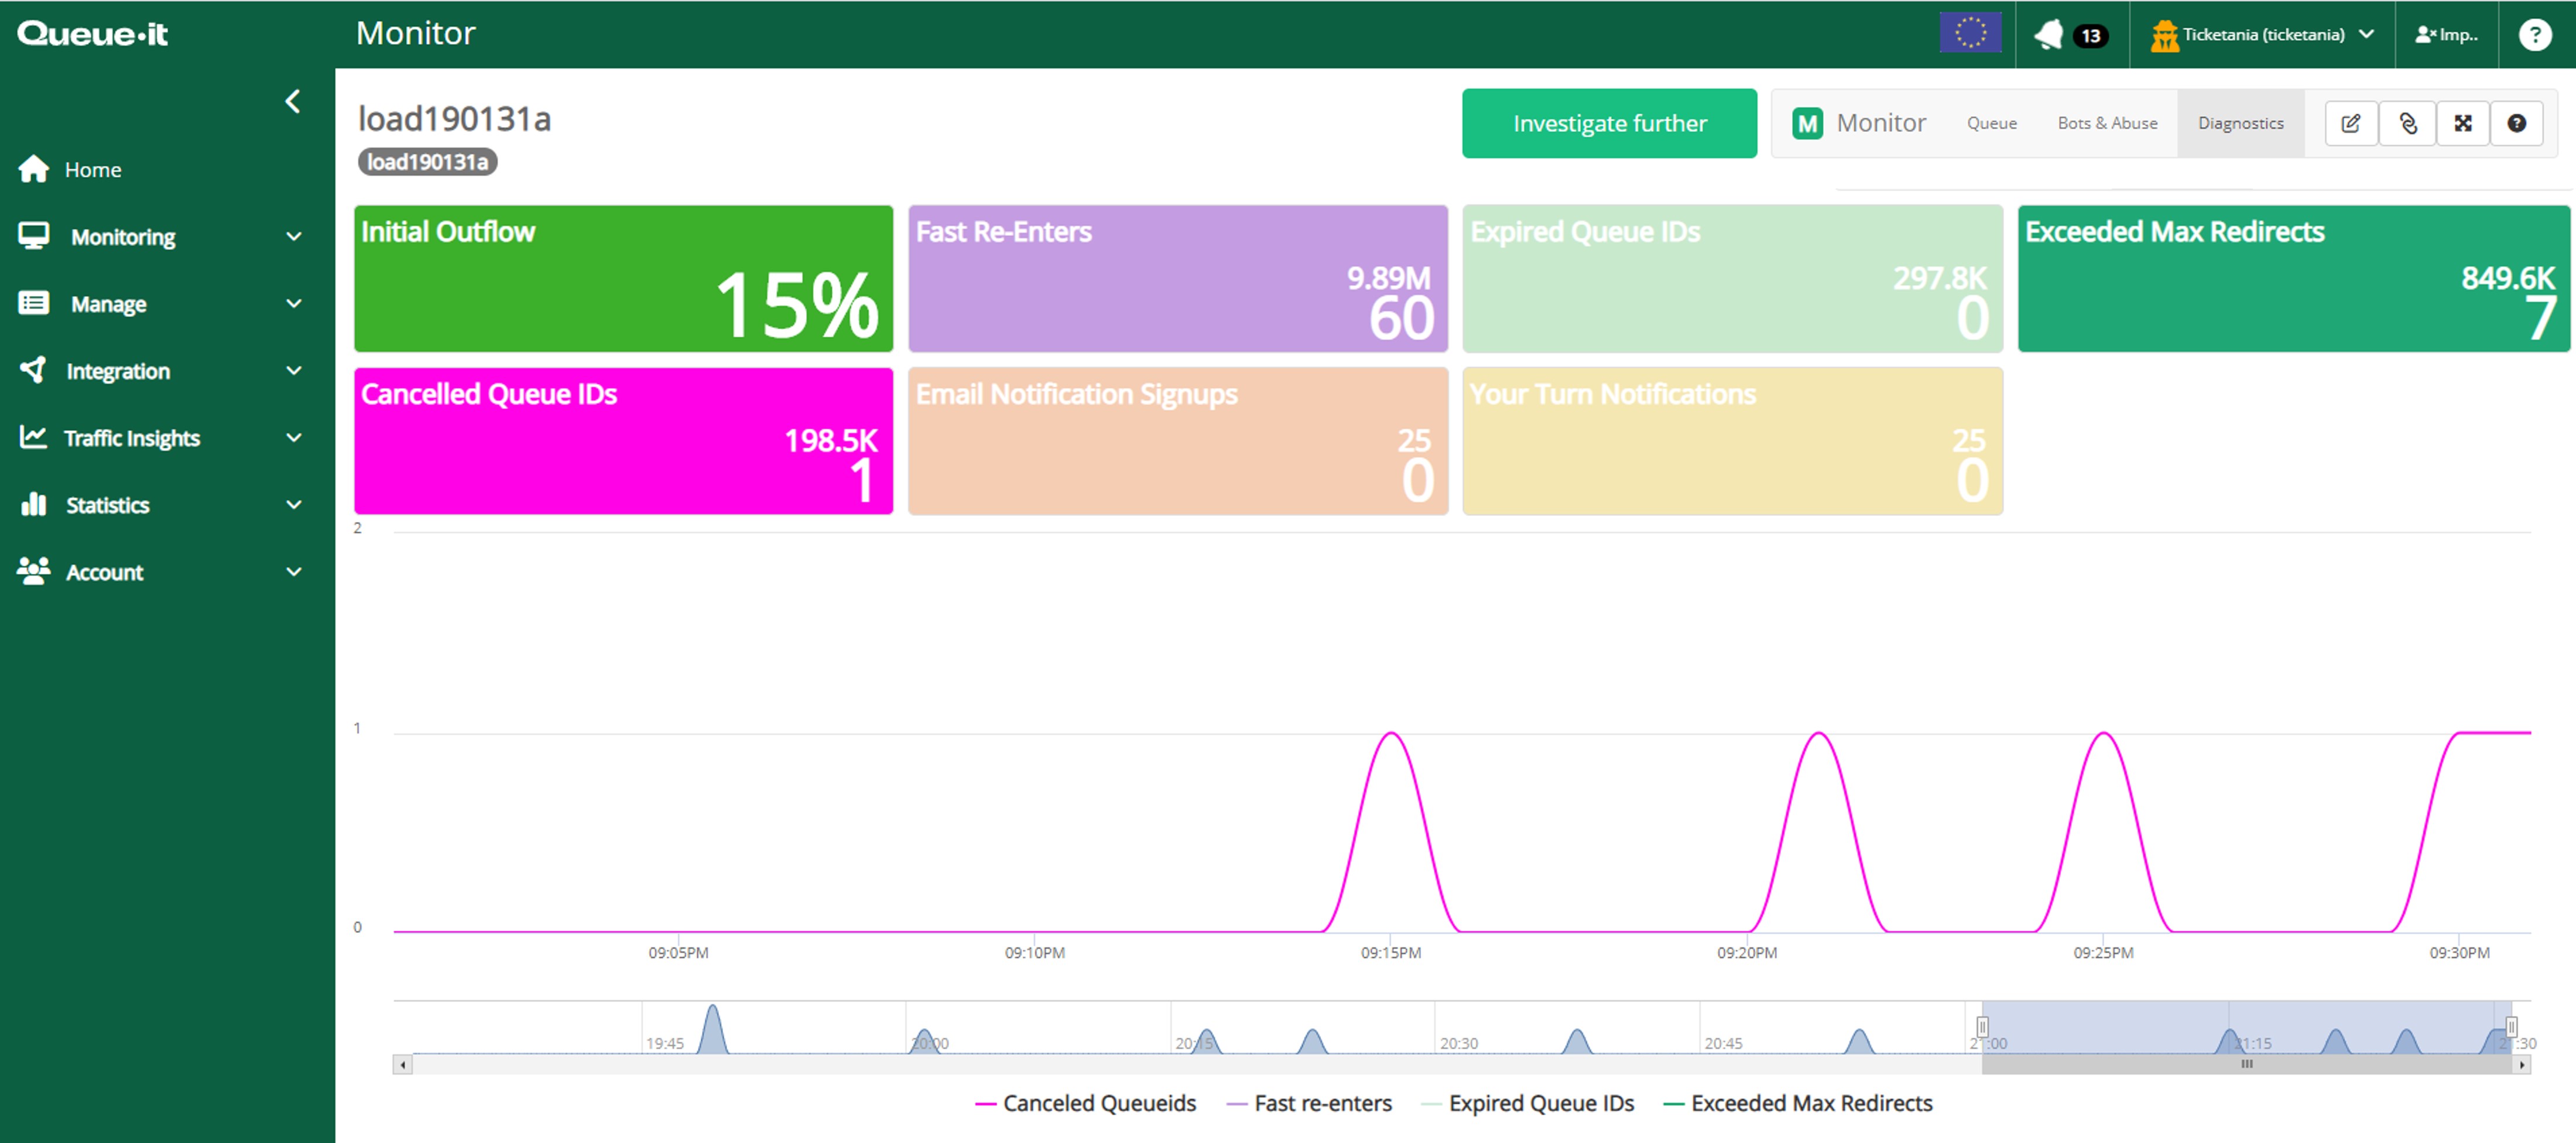
You get all the waiting room data you’ve come to expect, plus the ability to toggle and see the following data points:
Fast Re-enters
This metric shows the number of visitors who have been through the waiting room, only to find their way back to the waiting room soon after.
A high number could indicate an issue with the integration, causing visitors to be looped between the waiting room and the destination site. Or, it could point to performance issues with the destination website, causing visitors to navigate back.
Expired Queue IDs
This metric shows the number of visitors attempting to get through the waiting room after their turn has expired.
There will always be a natural flow of visitors that rejoin the waiting room with a Queue ID that is expired, but a high number may indicate that there is a mismatch between the session timeout of the target website and the Queue ID validity time.
Exceeded Redirects
This metric shows the number of visitors who pass through the waiting room more times than they are allowed, based on the Max Redirects Per Queue ID field in the Waiting Room settings.
A high number could indicate an issue with the integration, causing visitors to be looped between the waiting room and the destination site.
Initial Outflow
This metric shows the percentage of visitors who were redirected from the waiting room to the destination site on their first try.
The higher the percentage, the better. A low number is normally an indication that there is a problem with the user flow.
Cancelled Queue IDs
This metric shows the number of queue IDs that have been cancelled by the Cancel Action or through the API.
Email Notification Signups/Your Turn Notifications
This metric shows the number of visitors who have entered their email address to receive a notification when it’s their turn in line, and the number of emails sent.
How To
You can find the option to toggle between the Standard and Diagnostics data in the upper righthand corner of the Waiting Room Monitor. You can access the Waiting Room Monitor by selecting an event under Manage | Events and choosing Monitor.
The Diagnostics tab will be available to all Queue-it customers at no additional cost.
Key Takeaway
The new Diagnostics tab on the Waiting Room Monitor gives you additional data to stay one step ahead of any problems with the visitor flow of your waiting room.
For more information on how you can use Queue-it’s analytics to get the data-driven business insights you want, contact your Queue-it support representative at support@queue-it.com.